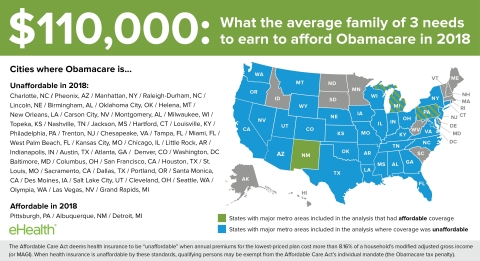
With just a 10% projected annual rate increase for 2018, many
families in 47 of 50 surveyed cities would have no access to coverage
that meets Obamacare’s affordability criteria and would likely be exempt
from the Obamacare tax penalty
MOUNTAIN VIEW, Calif.--(BUSINESS WIRE)--Sep. 26, 2017--
According to a study released today by eHealth, Inc. (NASDAQ:EHTH),
which operates eHealth.com,
the average family of three earning slightly too much to qualify for
subsidies in 2018 would need to increase its household income by nearly
$29,000 before health insurance became “affordable” based on Obamacare
criteria.
This Smart News Release features multimedia. View the full release here:
http://www.businesswire.com/news/home/20170926005576/en/
Obamacare affordability projected for 2018 (Photo: Business Wire)
The Affordable Care Act (ACA or Obamacare) considers health insurance to
be “unaffordable” when annual premiums for the lowest-priced plan in a
market cost more than 8.16% of a household’s modified adjusted gross
income (or MAGI).
When health insurance is unaffordable by this standard, individuals and
families may qualify for an exemption from Obamacare’s individual
mandate to buy health insurance.
Government subsidies are available to people earning up to 400% of the
federal poverty level, but middle-income households earning 401% or more
of the federal poverty level are not eligible for subsidy assistance.
In preparing its analysis, eHealth reviewed the lowest-price 2017 plan
available for families of three comprised of two adults age 35 and one
child. The same family model was analyzed using data from Healthcare.gov
in 40 cities, data from eHealth.com in 9 cities not utilizing
Healthcare.gov, and data from the New York state exchange for New York
City.
After applying a relatively modest annual rate increase of 10% to 2017
rates to project 2018 rates, eHealth discovered the following:
-
In 47 of 50 cities surveyed, the lowest-priced plan would be
officially unaffordable under Obamacare affordability standards for
families earning 401% of the federal poverty level (about $82,000 per
year in the contiguous US, making them ineligible for Obamacare
subsidies).
-
Among these, the average three-person household would need to earn an
additional $28,939 per year before the lowest-cost plan becomes
affordable according to Obamacare rules.
These figures are based on a uniform, conservative 10% increase in
health insurance premiums between 2017 and 2018. In fact, some independent
projections for 2018 have estimated that premiums may increase 20%
or more on average. There will likely be significant variability in the
actual rate increase in 2018 for each plan and each market.
Specific findings for surveyed cities are found below. A detailed
analysis providing additional context may also be reviewed as an appendix
prepared by eHealth which pairs the findings here with demographic
data describing each city’s median age, median household size, and
median income.
“Coverage under the Affordable Care Act is becoming seriously
unaffordable for many families, even by Obamacare’s own rules,” said
eHealth CEO Scott Flanders. “I find it hard to believe that the framers
of the law ever intended the cost of family health insurance to rival
that of a second mortgage. Without the introduction of lower-cost
options into the market or expanded government subsidies, many
middle-income Americans are in danger of being priced out of the health
insurance market entirely.”
Of the fifty cities surveyed, only Detroit, MI; Albuquerque, NM; and
Pittsburgh, PA showed no affordability gap with the projected 2018 rate
increases. These cities are described first in the table below, while
subsequent cities are given in order from least affordable (that is,
with the largest affordability gap) to most affordable (with the
smallest affordability gap).
|
|
|
Affordability by Surveyed City for a Family of Three
|
|
|
|
|
|
|
|
|
|
|
|
|
|
|
|
|
|
|
|
|
|
|
|
|
|
Affordability
|
|
Affordability gap
|
|
|
|
|
|
|
Projected 2018
|
|
Subsidy threshold
|
|
threshold (annual
|
|
(additional
|
|
|
|
|
2017 annual
|
|
premiums
|
|
(annual income at
|
|
income at which
|
|
income needed to
|
|
|
City/Metro area
|
|
premium for
|
|
with 10%
|
|
which subsidies
|
|
projected
|
|
make projected
|
|
|
|
|
lowest-cost
|
|
increase
|
|
are no longer
|
|
premiums become
|
|
premiums
|
|
|
|
|
plan
|
|
over 2017
|
|
available)
|
|
"affordable")
|
|
"affordable")
|
|
|
|
|
|
|
|
|
|
|
|
|
|
|
|
Detroit, MI
|
|
$5,544.00
|
|
$6,098.40
|
|
$81,884.00
|
|
$74,735.29
|
|
$(7,148.71)
|
|
|
Albuquerque, NM
|
|
$5,800.08
|
|
$6,380.09
|
|
$81,884.00
|
|
$78,187.35
|
|
$(3,696.65)
|
|
|
Pittsburgh, PA
|
|
$5,972.16
|
|
$6,569.38
|
|
$81,884.00
|
|
$80,507.06
|
|
$(1,376.94)
|
|
|
Charlotte, NC
|
|
$13,659.00
|
|
$15,024.90
|
|
$81,884.00
|
|
$184,128.68
|
|
$102,244.68
|
|
|
Phoenix, AZ
|
|
$12,881.28
|
|
$14,169.41
|
|
$81,884.00
|
|
$173,644.71
|
|
$91,760.71
|
|
|
Manhattan, NY
|
|
$12,552.60
|
|
$13,807.86
|
|
$81,884.00
|
|
$169,213.97
|
|
$87,329.97
|
|
|
Raleigh-Durham, NC
|
|
$11,083.80
|
|
$12,192.18
|
|
$81,884.00
|
|
$149,413.97
|
|
$67,529.97
|
|
|
Lincoln, NE
|
|
$11,082.36
|
|
$12,190.60
|
|
$81,884.00
|
|
$149,394.56
|
|
$67,510.56
|
|
|
Birmingham, AL
|
|
$10,247.16
|
|
$11,271.88
|
|
$81,884.00
|
|
$138,135.74
|
|
$56,251.74
|
|
|
Oklahoma City, OK
|
|
$10,083.24
|
|
$11,091.56
|
|
$81,884.00
|
|
$135,926.03
|
|
$54,042.03
|
|
|
Helena, MT
|
|
$9,978.12
|
|
$10,975.93
|
|
$81,884.00
|
|
$134,508.97
|
|
$52,624.97
|
|
|
New Orleans, LA
|
|
$9,819.00
|
|
$10,800.90
|
|
$81,884.00
|
|
$132,363.97
|
|
$50,479.97
|
|
|
Carson City, NV
|
|
$9,746.16
|
|
$10,720.78
|
|
$81,884.00
|
|
$131,382.06
|
|
$49,498.06
|
|
|
Montgomery, AL
|
|
$9,632.16
|
|
$10,595.38
|
|
$81,884.00
|
|
$129,845.29
|
|
$47,961.29
|
|
|
Milwaukee, WI
|
|
$9,544.80
|
|
$10,499.28
|
|
$81,884.00
|
|
$128,667.65
|
|
$46,783.65
|
|
|
Topeka, KS
|
|
$9,342.84
|
|
$10,277.12
|
|
$81,884.00
|
|
$125,945.15
|
|
$44,061.15
|
|
|
Nashville, TN
|
|
$9,240.96
|
|
$10,165.06
|
|
$81,884.00
|
|
$124,571.76
|
|
$42,687.76
|
|
|
Jackson, MS
|
|
$9,020.16
|
|
$9,922.18
|
|
$81,884.00
|
|
$121,595.29
|
|
$39,711.29
|
|
|
Hartford, CT
|
|
$8,985.72
|
|
$9,884.29
|
|
$81,884.00
|
|
$121,131.03
|
|
$39,247.03
|
|
|
Louisville, KY
|
|
$8,905.32
|
|
$9,795.85
|
|
$81,884.00
|
|
$120,047.21
|
|
$38,163.21
|
|
|
Philadelphia, PA
|
|
$8,778.60
|
|
$9,656.46
|
|
$81,884.00
|
|
$118,338.97
|
|
$36,454.97
|
|
|
Trenton, NJ
|
|
$8,770.68
|
|
$9,647.75
|
|
$81,884.00
|
|
$118,232.21
|
|
$36,348.21
|
|
|
Chesapeake, VA
|
|
$8,724.84
|
|
$9,597.32
|
|
$81,884.00
|
|
$117,614.26
|
|
$35,730.26
|
|
|
Tampa, FL
|
|
$8,270.64
|
|
$9,097.70
|
|
$81,884.00
|
|
$111,491.47
|
|
$29,607.47
|
|
|
Miami, FL
|
|
$7,921.68
|
|
$8,713.85
|
|
$81,884.00
|
|
$106,787.35
|
|
$24,903.35
|
|
|
West Palm Beach, FL
|
|
$7,834.68
|
|
$8,618.15
|
|
$81,884.00
|
|
$105,614.56
|
|
$23,730.56
|
|
|
Kansas City, MO
|
|
$7,806.00
|
|
$8,586.60
|
|
$81,884.00
|
|
$105,227.94
|
|
$23,343.94
|
|
|
Chicago, IL
|
|
$7,779.12
|
|
$8,557.03
|
|
$81,884.00
|
|
$104,865.59
|
|
$22,981.59
|
|
|
Little Rock, AR
|
|
$7,662.00
|
|
$8,428.20
|
|
$81,884.00
|
|
$103,286.76
|
|
$21,402.76
|
|
|
Indianapolis, IN
|
|
$7,607.64
|
|
$8,368.40
|
|
$81,884.00
|
|
$102,553.97
|
|
$20,669.97
|
|
|
Austin, TX
|
|
$7,377.12
|
|
$8,114.83
|
|
$81,884.00
|
|
$99,446.47
|
|
$17,562.47
|
|
|
Atlanta, GA
|
|
$7,351.80
|
|
$8,086.98
|
|
$81,884.00
|
|
$99,105.15
|
|
$17,221.15
|
|
|
Denver, CO
|
|
$7,321.20
|
|
$8,053.32
|
|
$81,884.00
|
|
$98,692.65
|
|
$16,808.65
|
|
|
Washington, DC
|
|
$7,254.24
|
|
$7,979.66
|
|
$81,884.00
|
|
$97,790.00
|
|
$15,906.00
|
|
|
Baltimore, MD
|
|
$7,251.12
|
|
$7,976.23
|
|
$81,884.00
|
|
$97,747.94
|
|
$15,863.94
|
|
|
Columbus, OH
|
|
$7,063.08
|
|
$7,769.39
|
|
$81,884.00
|
|
$95,213.09
|
|
$13,329.09
|
|
|
San Francisco, CA
|
|
$7,034.88
|
|
$7,738.37
|
|
$81,884.00
|
|
$94,832.94
|
|
$12,948.94
|
|
|
Houston, TX
|
|
$6,993.24
|
|
$7,692.56
|
|
$81,884.00
|
|
$94,271.62
|
|
$12,387.62
|
|
|
St. Louis, MO
|
|
$6,972.96
|
|
$7,670.26
|
|
$81,884.00
|
|
$93,998.24
|
|
$12,114.24
|
|
|
Sacramento, CA
|
|
$6,904.92
|
|
$7,595.41
|
|
$81,884.00
|
|
$93,081.03
|
|
$11,197.03
|
|
|
Dallas, TX
|
|
$6,858.72
|
|
$7,544.59
|
|
$81,884.00
|
|
$92,458.24
|
|
$10,574.24
|
|
|
Portland, OR
|
|
$6,768.00
|
|
$7,444.80
|
|
$81,884.00
|
|
$91,235.29
|
|
$9,351.29
|
|
|
Santa Monica, CA
|
|
$6,662.76
|
|
$7,329.04
|
|
$81,884.00
|
|
$89,816.62
|
|
$7,932.62
|
|
|
Des Moines, IA
|
|
$6,641.64
|
|
$7,305.80
|
|
$81,884.00
|
|
$89,531.91
|
|
$7,647.91
|
|
|
Salt Lake City, UT
|
|
$6,595.44
|
|
$7,254.98
|
|
$81,884.00
|
|
$88,909.12
|
|
$7,025.12
|
|
|
Cleveland, OH
|
|
$6,516.72
|
|
$7,168.39
|
|
$81,884.00
|
|
$87,847.94
|
|
$5,963.94
|
|
|
Seattle, WA
|
|
$6,415.08
|
|
$7,056.59
|
|
$81,884.00
|
|
$86,477.79
|
|
$4,593.79
|
|
|
Olympia, WA
|
|
$6,415.08
|
|
$7,056.59
|
|
$81,884.00
|
|
$86,477.79
|
|
$4,593.79
|
|
|
Las Vegas, NV
|
|
$6,251.16
|
|
$6,876.28
|
|
$81,884.00
|
|
$84,268.09
|
|
$2,384.09
|
|
|
Grand Rapids, MI
|
|
$6,127.80
|
|
$6,740.58
|
|
$81,884.00
|
|
$82,605.15
|
|
$721.15
|
|
|
50 City Average
|
|
$8,221.08
|
|
$9,043.18
|
|
$81,884.00
|
|
$110,823.32
|
|
$28,939.32
|
|
|
Refer to the appendix
prepared by eHealth providing additional context including median
age, household size, and income for each of the cities surveyed in this
report.
Methodology
eHealth prepared the present analysis by surveying 2017 premiums for the
lowest-cost ACA-compliant plan available in fifty cities and/or
metropolitan areas. Rates were gathered through the federally-run health
insurance exchange Healthcare.gov, with the exceptions of New York, New
York (gathered from the New York state exchange) and the following
cities located in states not served by Healthcare.gov where rates were
gathered from plans offered through eHealth.com: Hartford, CT;
Washington, DC; Baltimore, MD, Denver, CO, Santa Monica, San Francisco
and Sacramento, CA; Seattle and Olympia, WA.
The rates quoted in eHealth’s analysis are for family groups of three in
which two adults are aged 35 years. Premium projections for 2018 are
calculated as a ten percent increase over 2017. This uniform ten percent
projected increase is simply an assumption used for this analysis and is
not intended to imply that all plans will uniformly increase at the same
rate or to reflect the actual rate increase for any specific plan in any
market or for any aggregated set of plans. Each plan in each market will
have its own actual rate increase (or, possibly in some cases, decrease)
for 2018. It should be noted that rates may in some cases vary from zip
code to zip code within the same metropolitan area or state and that
less costly plans may be available in some cases to consumers who do not
utilize the health insurance exchanges and marketplaces noted above. In
addition, this analysis does not attempt to predict legislative,
regulatory, or other changes that may affect the actual 2018 rates for
plans.
In determining the subsidy threshold – the point at which government
subsidies are no longer available to persons purchasing qualifying
health plans – eHealth employed federal poverty level guidelines for
2017. Subsidies may be available to persons with a household income of
up to 400% of the federal poverty level; as such, eHealth’s described
“subsidy threshold” is calculated at 401% of the federal poverty level
for 2017. The “affordability threshold” is calculated as the annual
household income level at which eHealth’s 2018 premium projections
attain to 8.16% of household income. This is the point at which the
lowest-priced available plan is considered unaffordable under the rules
of the Affordable Care Act for 2017.
About eHealth
eHealth, Inc. (NASDAQ:EHTH) owns eHealth.com, a leading private online
health insurance exchange where individuals, families and small
businesses can compare health insurance products from brand-name
insurers side by side and purchase and enroll in coverage online and
over the phone. eHealth offers thousands of individual, family and small
business health plans underwritten by many of the nation's leading
health insurance companies. eHealth (through its subsidiaries) is
licensed to sell health insurance in all 50 states and the District of
Columbia. eHealth also offers educational resources, exceptional
telephonic support, and powerful online and pharmacy-based tools to help
Medicare beneficiaries navigate Medicare health insurance options,
choose the right plan and enroll in select plans online or over the
phone through Medicare.com (www.Medicare.com),
eHealthMedicare.com (www.eHealthMedicare.com)
and PlanPrescriber.com (www.PlanPrescriber.com).
For more health insurance news and information, visit eHealth's Consumer
Resource Center.

View source version on businesswire.com: http://www.businesswire.com/news/home/20170926005576/en/
Source: eHealth, Inc.
DMA Communications for eHealth, Inc.
Sande Drew, 916-207-7674
sande.drew@ehealth.com
or
eHealth,
Inc.
Nate Purpura, 650-210-3115
nate.purpura@ehealth.com